
Tableau vs Power BI
Tableau vs Power BI in 2026
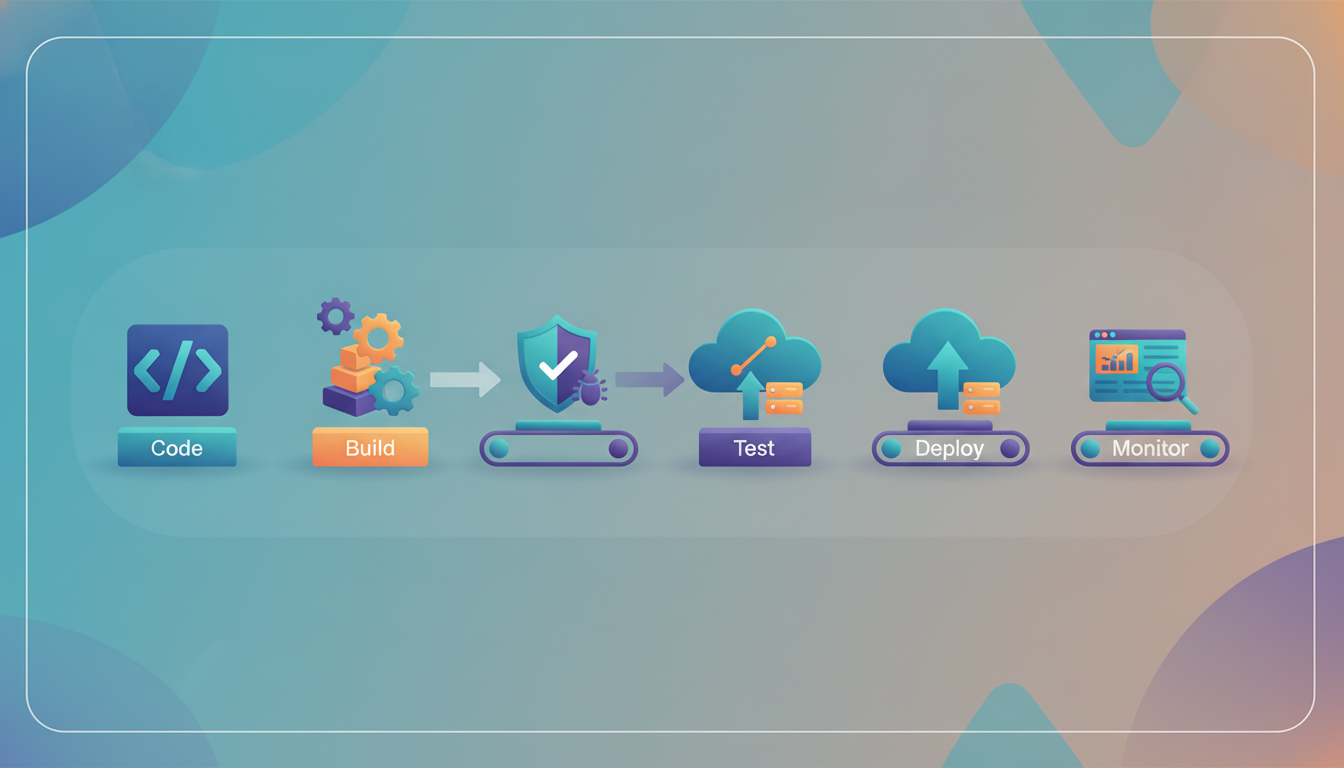
Business Intelligence (BI) and data visualization tools have become essential for modern organizations. Companies use BI platforms to analyze data, generate reports, create dashboards, and make data-driven decisions.
Two of the most popular BI tools are:
- Tableau
- Power BI
Both tools provide powerful analytics and visualization capabilities, but they differ in pricing, usability, scalability, integrations, and performance.
This detailed Tableau vs Power BI comparison explains their differences, advantages, and which tool is better for beginners, analysts, and enterprises in 2026.
For learners looking for live mentoring, dashboard projects, and analytics guidance, explore Data Analysis Tutors.
What is Tableau?
Tableau is a Business Intelligence and data visualization platform used for creating interactive dashboards and advanced analytics.
Tableau is widely known for:
- Powerful visualizations
- Interactive dashboards
- Advanced analytics
- Large-scale data exploration
Tableau is heavily used in enterprise analytics environments. (tableau.com)
What is Power BI?
Microsoft Power BI is a Business Intelligence tool developed by Microsoft.
Power BI helps users:
- Create dashboards
- Analyze data
- Build reports
- Share insights
Power BI is highly popular because of its Microsoft ecosystem integration and affordability. (learn.microsoft.com)
Tableau vs Power BI: Quick Comparison
Feature | Tableau | Power BI |
Developed By | Tableau/Salesforce | Microsoft |
Ease of Use | Moderate | Beginner-friendly |
Visualization | Excellent | Strong |
Pricing | Expensive | Affordable |
Data Handling | Large-scale analytics | Strong business analytics |
Integration | Broad | Excellent with Microsoft tools |
Performance | Excellent | Very Good |
Learning Curve | Steeper | Easier |
Tableau vs Power BI: Ease of Learning
Power BI Learning Curve
Power BI is generally easier for beginners.
Why?
- Simple interface
- Excel-like environment
- Drag-and-drop dashboard creation
Power BI is often recommended for beginners entering Data Analytics.
Tableau Learning Curve
Tableau offers more advanced visualization flexibility but has a steeper learning curve.
Users often need more practice to master Tableau’s advanced analytics features.
Tableau vs Power BI: Data Visualization
Tableau Visualization
Tableau is widely considered one of the best visualization platforms.
Advantages
- Advanced interactive dashboards
- Rich visual customization
- Complex analytics visuals
Tableau excels in advanced storytelling and visualization design.
Power BI Visualization
Power BI also provides strong dashboard capabilities.
Advantages
- Easy dashboard creation
- Strong business reporting
- Interactive charts
Power BI is highly effective for business analytics and enterprise reporting.
Tableau vs Power BI: User Interface
Power BI Interface
Power BI has a beginner-friendly interface similar to Microsoft Excel.
This makes it easier for:
- Business users
- Excel users
- Beginners
Tableau Interface
Tableau provides advanced visualization flexibility but may initially feel more complex.
Professional analysts often prefer Tableau for advanced customization.
Tableau vs Power BI: Pricing Comparison
Power BI Pricing
Power BI is more affordable and offers free desktop usage.
Benefits
- Budget-friendly
- Lower enterprise costs
- Strong value for businesses
Power BI is highly popular among startups and mid-sized companies.
Tableau Pricing
Tableau is more expensive, especially for enterprise deployments.
However, it offers advanced analytics and visualization capabilities.
Tableau vs Power BI: Data Handling
Tableau Data Handling
Tableau handles large datasets efficiently and supports advanced analytics workflows.
Power BI Data Handling
Power BI also handles large datasets effectively, especially within Microsoft ecosystems.
Both tools perform strongly in business intelligence workflows.
Tableau vs Power BI: Performance
Tableau Performance
Tableau performs exceptionally well for:
- Large-scale analytics
- Complex visualizations
- Interactive dashboards
Power BI Performance
Power BI performs strongly for:
- Business reporting
- KPI dashboards
- Enterprise analytics
Performance optimization depends heavily on dataset size and dashboard design.
Tableau vs Power BI: Integration Capabilities
Power BI Integrations
Power BI integrates deeply with Microsoft products such as:
- Excel
- Azure
- SQL Server
- Office 365
Microsoft ecosystem integration is one of Power BI’s biggest strengths.
Tableau Integrations
Tableau integrates with multiple platforms and cloud services.
Examples
- AWS
- Google Cloud
- Salesforce
Tableau supports broad enterprise integrations.
Tableau vs Power BI: Cloud Support
Power BI Cloud Features
Power BI Service enables:
- Cloud dashboards
- Team collaboration
- Real-time sharing
Tableau Cloud Features
Tableau Cloud also supports scalable cloud analytics and collaboration.
Cloud-based BI adoption continues increasing globally.
Tableau vs Power BI: AI & Advanced Analytics
Tableau AI Features
Tableau supports advanced analytics and AI-driven insights.
Power BI AI Features
Power BI includes:
- AI visuals
- Natural language queries
- Automated insights
AI-powered analytics are becoming increasingly important in BI platforms.
For practical dashboard mentoring and analytics projects, explore Data Analysis Tutors.
Tableau vs Power BI: Dashboard Capabilities
Tableau Dashboards
Tableau dashboards are highly interactive and visually advanced.
Ideal for:
- Data storytelling
- Executive analytics
- Complex visual reports
Power BI Dashboards
Power BI dashboards are excellent for:
- Business reporting
- KPI monitoring
- Enterprise analytics
Both platforms provide strong dashboard functionality.
Tableau vs Power BI: Mobile Support
Both tools support mobile dashboards.
Mobile Features Include
- Real-time monitoring
- Dashboard access
- Notifications
Mobile BI usage continues growing rapidly.
Tableau vs Power BI: Security
Power BI Security
Power BI provides enterprise-grade Microsoft security integrations.
Tableau Security
Tableau also offers strong enterprise security and governance controls.
Security remains critical in modern analytics environments.
Tableau vs Power BI: Career Opportunities
Both tools offer strong career opportunities in Data Analytics and Business Intelligence.
Popular Roles
- Data Analyst
- BI Developer
- Business Analyst
- Analytics Consultant
Analytics professionals remain highly demanded globally.
Tableau vs Power BI Salary in India
Experience | Average Salary |
Fresher | ₹4–8 LPA |
Mid-Level | ₹10–18 LPA |
Experienced | ₹25+ LPA |
Professionals with SQL, cloud, and visualization expertise often earn higher salaries.
Which is Better for Beginners?
Choose Power BI If You Want
- Easier learning
- Affordable pricing
- Microsoft ecosystem integration
- Business reporting
Power BI is often the best choice for beginners.
Choose Tableau If You Want
- Advanced visualizations
- Complex analytics
- Enterprise-level data storytelling
Tableau is highly powerful for advanced analytics professionals.
Tableau vs Power BI: Best Use Cases
Use Case | Better Choice |
Beginners | Power BI |
Advanced Visualization | Tableau |
Enterprise Reporting | Power BI |
Data Storytelling | Tableau |
Budget-Friendly BI | Power BI |
Complex Analytics | Tableau |
Future Scope of Tableau & Power BI
Both tools continue growing because of:
- Data-driven businesses
- AI-powered analytics
- Cloud reporting
- Real-time dashboards
Business Intelligence remains one of the fastest-growing technology domains.
Best Way to Learn BI Tools
Beginner Roadmap
- Learn Excel & SQL
- Learn Data Analytics basics
- Learn Power BI or Tableau
- Build dashboards
- Learn DAX or Tableau calculations
- Build real-world analytics projects
Hands-on dashboard projects are essential for becoming job-ready.
For live mentoring, analytics projects, and dashboard guidance, explore Data Analysis Tutors.
Final Verdict: Tableau vs Power BI
Both Tableau and Power BI are powerful Business Intelligence tools.
- Power BI is best for beginners, affordability, and Microsoft integration
- Tableau is best for advanced visualizations and complex analytics
For most beginners and business users in 2026, Power BI is often the preferred starting point because of ease of learning and cost efficiency.
However, Tableau remains one of the strongest enterprise visualization platforms.
FAQs
Which is better: Tableau or Power BI?
Power BI is generally better for beginners and affordability, while Tableau excels in advanced visualization and analytics.
Is Power BI easier than Tableau?
Yes, Power BI usually has a simpler learning curve for beginners.
Which tool has better visualization capabilities?
Tableau is widely known for advanced and highly interactive visualizations.
Which BI tool has more job opportunities?
Both tools offer strong career opportunities, but Power BI currently has broader adoption because of Microsoft integration.
Where can I learn Power BI and Tableau with mentorship?
You can get live tutoring, dashboard projects, and analytics guidance through Data Analysis Tutors.


Add a comment